


We have launched E-mail Alert service,subscribers can receive the latest catalogues free of charge

The Connotation of and Analytical Approach toward China-US Industrial Complementarities
2008-12-09


Zhang Liping
I. Industry Complementarities
It is necessary to clarify the concept of industry complementarity first when we study the industry complementarities between China and the United States. References searching finds few explicit definition concerning industry complementarity either in China or abroad.
In Western economics, complementarity is primarily used in the scope of merchandise. According to some definitions, complementarity refers to relations among commodities. If the consumption growth of one commodity leads to the consumption growth of another, these two commodities are considered as complementary goods, for example, cars and gas. Usually, complementary goods are the commodities used at the same time in certain or standard ratio. This concept is equally applicable to industry scope. If the development of one industry propels another, these two industries are regarded as complementary, and such complementarity is defined as "one's development is determined by the other's development". However, it is too limited to define industry complementarity as this. Besides "one's development is determined by the other's development" type,there is another case of complementarity called "one has what the other lacks" type, arising from crossing industries. Such complementarity represents the relationship between supply and demand, like the textile industry in China and the United States. Opposite to complementary relations are competitive or substitute relations. If the development of one industry leads to the recession of another industry, these two industries are regarded as competitive or substitutable.
No matter the industrial relation is competitive or complementary, and no matter such complementarity takes forms of "one has what the other lacks" or "one's development is determined by the other's development", such relations all stem from the international division of labor. Vertical international division of labor creates industry complementarities among countries, while horizontal division of labor brings about industrial competition. As for vertical division, the inter-industry division forms the complementarity of "one has what the other lacks", while the intra-industry division shapes the complementarity of "one's development is determined by the other's development" and both of these complementarities are manifested as different modes of trade. As shown in the figure below, three industrial relations lead to three different modes of trade: "one has what the other lacks" is manifested as one-way trade among industries; "one's development is determined by the other's development" is manifested as vertical intra-industry trade; competitive industrial relation is manifested as horizontal intra-industry trade.
Chart 1 Division of Labor, Industrial Relations and Trade Modes
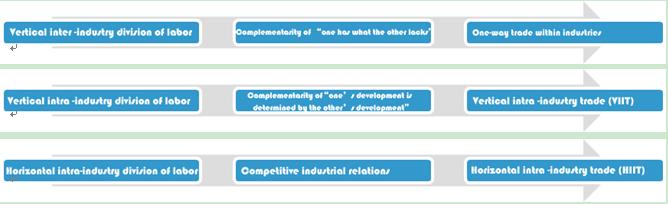
Division of Labor, Industrial Relations and Types of Trade
Source: Figure made by the author
Based on this conceptual framework, this study tries to make an in-depth and comprehensive analysis on industry complementarities between China and the United States.
To accurately reflect industrial complementarities between China and the United States, we take an indirect analytical approach, by first analyzing the differences of Chinese and American industries, then studying the correlation among bilateral industries and finally finding out the industry complementarities between China and the United States. The internal logic of this analytical approach is as follows: differences are the prerequisite of complementarities while correlations are significant necessary conditions for complementarities. However, in scope of industry, both complementarities of "one has what the other lacks" and "one's development is determined by the other's development" are first manifested as differences, which are presented as absolute differences in type of "one has what the other lacks" and as relative differences in type of "one's development is determined by the other's development". The purpose of this study is to verify the symbiosis of Chinese and American economies in scope of industry. In case industries of two countries complementary to each other only because of huge differences rather than any correlations, such complementarities are meaningless to two economies.
II Isomorphous Analysis of Industry Differences between China and the United States
The following industry isomorphism1 index is devised based on trade similarity index:
I_ij represents the percentage of added value of industry i in the GDP of country j, while I_ik represents the percentage of added value of industry i in the GDP of country k.

S_jk∈[0,100],the higher it is, the more isomorphous are the industries of two countries. The lower it is, the less isomorphous and the more isomerous are the industries of two countries.
To make the conclusion more comparable, we use the data released by the United Nations on industrial added value of each country. In respect of time span, we take the period starting from reform and opening-up in China to study the longitudinal changes in Sino-American industrial institutions. In respect of country selection, besides China and the United States, we select Thailand and Germany to make lateral comparison of isomorphism of Sino-American industries. The results are shown below in Table 1.
Table 1 The Isomorphism Index of Industrial Structure of Selected Countries
|
Time |
Sino-American |
Sino-German |
Sino-Thai |
American-German |
American-Thai |
|
1979 |
57 |
63 |
74 |
92 |
72 |
|
1980 |
58 |
62 |
74 |
92 |
73 |
|
1981 |
58 |
61 |
73 |
93 |
74 |
|
1982 |
57 |
62 |
70 |
93 |
75 |
|
1983 |
55 |
61 |
73 |
92 |
76 |
|
1984 |
60 |
64 |
75 |
93 |
79 |
|
1985 |
63 |
70 |
78 |
93 |
77 |
|
1986 |
62 |
70 |
79 |
92 |
76 |
|
1987 |
62 |
72 |
81 |
92 |
76 |
|
1988 |
62 |
70 |
82 |
91 |
75 |
|
1989 |
63 |
72 |
84 |
90 |
73 |
|
1990 |
61 |
69 |
80 |
90 |
71 |
|
1991 |
62 |
71 |
83 |
89 |
71 |
|
1992 |
63 |
70 |
84 |
91 |
75 |
|
1993 |
62 |
67 |
83 |
93 |
76 |
|
1994 |
62 |
67 |
82 |
93 |
76 |
|
1995 |
61 |
65 |
82 |
93 |
74 |
|
1996 |
60 |
64 |
82 |
92 |
73 |
|
1997 |
61 |
65 |
83 |
92 |
72 |
|
1998 |
62 |
69 |
87 |
94 |
67 |
|
1999 |
62 |
68 |
85 |
92 |
66 |
|
2000 |
63 |
68 |
86 |
92 |
64 |
|
2001 |
63 |
70 |
87 |
94 |
62 |
|
2002 |
63 |
71 |
87 |
93 |
60 |
|
2003 |
63 |
69 |
88 |
92 |
60 |
|
2004 |
63 |
70 |
90 |
92 |
61 |
|
2005 |
63 |
70 |
86 |
92 |
61 |
|
2006 |
63 |
71 |
89 |
91 |
60 |
Source: United Nations Website: http://unstats.un.org/
Based on longitudinal and lateral analysis, we can define the isomorphism of Sino-American industries in an objective way. Since China's reform and opening up, the isomorphism of industrial structures of two countries has been growing along with the burgeoning Chinese economy. The isomorphism index has risen from 57 in 1979 to 63 in 2006. Noticeably, the growth in isomorphism mainly took place in 1980s when there were only a few changes and there have been no changes ever since 2000. The probable cause underlying such situation is the stable chain relation between industrial structures of two countries. Therefore, the industrial structures are increasingly similar and there are no changes to the industrial differences.
Compared to Sino-German, Sino-Thai, American-German and American-Thai isomorphism indexes, Sino-American industrial isomorphism index is basically the lowest in the corresponding period. It shows that as time goes by, in spite of the growth, the industry isomorphism still keeps at a low level.
Summary: the analysis of isomorphism index indicates that Chinese and American industries are not very similar to each other. Based on the fact that Chinese and American industry isomorphism indexes remain unchanged in recent years, we could find that there is no direct conflict of substitution in the development of industrial structures, which further verifies the conclusion in part I.
…
If you need the full text, please leave a message on the website.
1Isomorphism indicates the similarity of industrial structure between two countries. The more isomorphous, the more similar the industrial structures of two countries. What always comes with isomorphism is isomerism. Similarly, the more isomerous, the more differences in the industrial structure of two economies and the less similar they are.