


We have launched E-mail Alert service,subscribers can receive the latest catalogues free of charge

An Analysis of China’s Consumer Demand for Grain and Policy Suggestions
2005-09-01


Han Jun, Xie Yang, Xiao Junyan, Cui Xiaoli, Yu Baoping, Pan Yaoguo& Luo Dan, Development Research Center of the State Council Research Report No. 073, 2005
In terms of purposes, the consumer demand for grain comprises four parts: food, feed, industrial use and seed. Estimated on the break-even volume, the total grain demand for a year should meet the following equation: the total grain demand for the year = grain inventory at beginning of the year + grain production of the year + net grain import of the year – grain inventory at year-end. Lack of data about grain inventory of each year makes it rather difficult to work out the data about grain consumption according to the above calculating method. The National Information Center for Grain and Oil estimates consumption of the main grain varieties each year. This is an important source of data for the study of grain consumption in China. Using the center’s relevant data, this report will analyze the features and trends of the changes in China’s consumer demand for grain and put forward related policy suggestions.
I. The Features of the Changes in China’s Consumer Demand for Grain
China’s grain statistics mainly cover cereal, beans and tubers. In recent five years, beans and tubers accounted for about 11-13 percent of the country’s total grain output. In other parts of the world, however, grain statistics cover cereal output only, and soybeans are regarded as oilseed. In order to integrate with international statistical standards, our analysis mainly focuses on consumer demand for cereals and soybeans.
1. While total cereal consumption has been growing slowly, the structure of cereal consumption has undergone major changes
Since 1990, the demand for cereals in general has been growing slowly. The average annual demand for cereals was 363.79 million tons during the 1990-1996 period, and rose by 2.65 percent to 373.41 million tons during the 1997-2003 period. What was noteworthy was that there had been tangible changes in the structure of the demand for cereals.
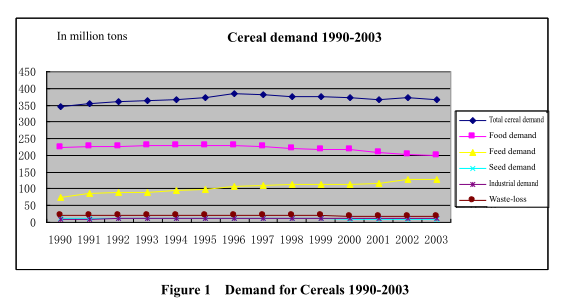
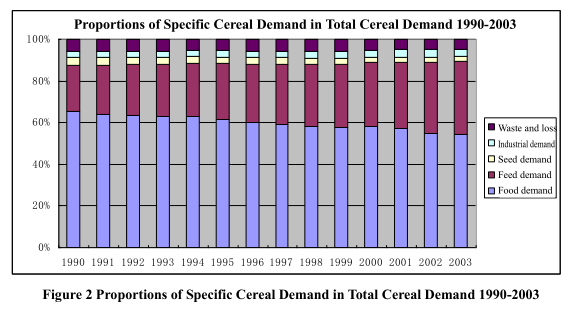
(2) The proportion of feed demand in the total demand for cereals rose drastically. From 1990 to 2003, feed demand almost rose straightly from 75.9 million tons in 1990 to 128.4 million tons in 2003, up 69.17 percent in all or five percentage points annually on average. Feed demand in 1990 accounted for 22 percent of the total demand for cereals, and the proportion continued to rise, to 34.9 percent in 2003 or up by one percentage point each year. Of the feed consumption, the proportion of maize rose from 80.7 percent in 1990 to 87.3 percent in 2003, while those of rice, wheat and other cereals respectively dropped from 11.7 percent, 3.3 percent and 4.3 percent in 1990 to 7.1 percent, two percent and 3.6 percent respectively in 2003.
(3) The changes in the proportions of seed grain, industrial grain and grain waste and loss in the total demand for cereals were insignificant. From 1990 to 2003, seed grain reduced by 4.5 million tons, industrial grains increased by 3.3 million tons, and grain waste and loss was three million tons less.
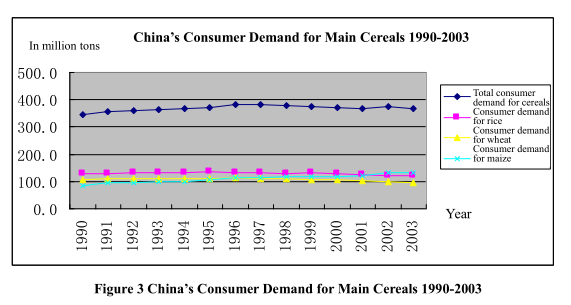
(1) The proportion of rice in the total demand for cereals continued to decline. From 1990 to 1997, total consumer demand for rice stayed above 130 million tons, the highest being 134.3 million tons in 1995. The consumer demand for rice declined visibly after 1999. In the four years from 1999 to 2003, total consumer demand for rice dropped from 130.7 million tons to 120.1 million tons, or 10.6 million tons decrease in all. The rate of decline was 8.11 percent, or 2.03 percentage points decrease per year. From 1990 to 2003, the proportion of consumer demand for rice in the total consumer demand for cereals dropped from 37.1 percent to 32.05 percent. This change was mainly attributable to the fact that over 80 percent of rice was consumed as food. In the past decade or so, China’s total grain demand was increasing, but the absolute amount of food consumption dropped visibly and so did the proportion of rice consumption.
(2) The proportion of wheat in the total consumer demand for cereals also continued to drop. During the 1990-2003 period, total wheat demand in general declined. The consumer demand for wheat was fairly high in the mid-1990s, the highest being 112.9 million tons in 1996. The demand dropped gradually later, to 97.2 million tons in 2003, below 100 million tons for the first time during this period. From 1990 to 2003, the proportion of wheat in the total consumer demand for cereals went down from 31.26 percent to 26.44 percent. This change was mainly attributable to the fact that over 80 percent of wheat was consumed as food.
(4) The proportion of other cereals in the total consumer demand for cereals dropped slightly, from 6.57 percent in 1990 to 5.27 percent in 2003. In addition, the absolute amount of these cereals consumed was insignificant, thus having only a minimum impact on the overall structure of consumer demand for all cereals.

…
If you need the full text, please leave a message on the website.