Daryl Guppy
Using effective currency hedging strategy
By Daryl Guppy (China Daily)
Updated: 2010-07-19 10:48
 |
Large Medium Small |
Chart patterns capture the diverse behavior of people. This includes the slow growth of confidence, seen in an up-sloping triangle pattern. It includes the swift growth of irrational exuberance, most clearly seen in bubble patterns and parabolic trends. When we understand the development of a particular behavior then we can also anticipate how and when the behavior may end. In the market this provides buy and sell points in the trend.

Some analysts take the next step and use patterns to predict the future. This is unwise. The chart pattern graphically illustrates the balance of probability. It indicates the most probable result, but it does not show the inevitable result. Investors assess the balance of probability and identify the price levels or behavior that show when the balance of probability has changed.
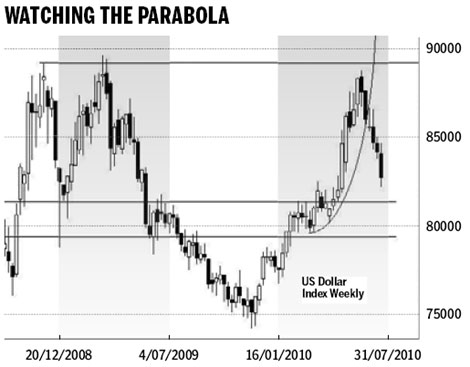
The parabolic trend is an unusual chart pattern. It captures a spurt of enthusiasm and it also does an excellent job of defining the end of the trend with an exact date. When the parabolic trend line is drawn, the end of the parabolic curve becomes vertical. This provides a fixed reference point or date. Every day a new price candle is added to the chart, slowly moving towards the fixed end date for the parabolic trend. When the price activity reaches the date there is a high probability the parabolic trend will end because the next price candle will move to the right of the parabolic trend line.
The next most important behavioral feature of this chart pattern is the rapid collapse when the parabolic trend ends. In May 2010 we identified a parabolic trend in the US dollar index and suggested the uptrend would finish at the end of June with a potential high near $0.89.
These conditions have developed and the US dollar index is falling rapidly towards $0.82. The parabolic trend identified high probability behavior for the trend, but it does not give information about how price behavior will develop after the collapse of the parabolic trend. The end of one chart pattern does not automatically lead to the development of a new chart pattern. New analysis methods must be applied to first identify the end of the new price trend and then the development of the next market behavior. The new market behavior may take several weeks before a new pattern is reliably identified.
|
||||


Investors who short the US dollar index use these as target levels and they are ready to cover their short positions. The market may move lower and develop consolidation in the historical consolidation band between $0.79 and $0.82. Exporters and importers watch these developments carefully because these consolidation areas provide the foundation for the next trend development. Consolidation shows the behavior of the market has changed and investors must prepare new strategies. The increase in currency volatility is a new feature of the currency market since 2008. Investors must learn to use effective currency hedging strategies and identify when the
probability of trend change is increasing.
The author is a well-known international financial technical analysis expert